
An industrial data management tool called AVEVA (Wonderware) Historian is used to gather, store, and analyse enormous volumes of time-series data from industrial processes. It is intended to manage the large volumes and rapid speeds of data produced by contemporary industrial machinery and procedures. Here are some salient characteristics and advantages:
1.Data Collection:
It collects data from various sources, including PLCs, SCADA systems, DCS, IoT devices, and other industrial equipment.
- Programmable Logic Controllers (PLCs): Connects directly to PLCs, which are used for automation of industrial processes.
- Supervisory Control and Data Acquisition (SCADA) Systems: Integrates with SCADA systems that monitor and control industrial processes.
- Distributed Control Systems (DCS): Collects data from DCS, which manage complex process control systems.
- IoT Devices: Gathers data from Internet of Things (IoT) devices used in industrial environments for additional monitoring and control.
- Sensors and Instrumentation: Acquires data from various sensors and instrumentation used for measuring physical conditions such as temperature, pressure, flow, and more.
- Enterprise Systems: Integrates with other enterprise systems such as MES (Manufacturing Execution Systems) and ERP (Enterprise Resource Planning) systems for a broader data perspective.
2.High Performance:
Designed to handle high-frequency data and large volumes, ensuring that even the most data-intensive environments are supported.
- Real-Time Data Handling: Processes and stores data in real-time, ensuring that current operational data is always available for analysis and decision-making.
- High-Frequency Data Collection: Capable of collecting data at very high frequencies, from milliseconds to seconds, to capture rapid changes in industrial processes.
- Optimized Storage Architecture: Utilizes a highly efficient data storage architecture that minimizes the storage footprint while maintaining high data integrity and availability.
- Data Compression: Implements advanced data compression algorithms to reduce the storage requirements for time-series data without sacrificing performance or accuracy.
3.Data Storage:
Efficiently stores time-series data, making it easily retrievable for historical analysis.
- Compression Techniques: Utilizes advanced data compression algorithms to minimize the storage footprint, allowing for the efficient storage of large volumes of data without compromising on performance.
- Tiered Storage Architecture: Employs a tiered storage approach that categorizes data based on its usage frequency and importance. Frequently accessed data is kept in faster, more expensive storage, while less frequently accessed data is stored in slower, more cost-effective media.
- Raw and Processed Data: Stores both raw data and processed (aggregated or summarized) data, providing flexibility for detailed analysis as well as long-term trend analysis.
4.Data Analysis:
Provides tools for analyzing historical data to identify trends, patterns, and anomalies, which can be used for optimizing operations and improving efficiency.
- SQL Queries: Supports SQL-based querying, enabling users to extract specific data sets and perform complex analysis using familiar database query languages.
- Pre-built Reports: Offers a range of pre-built reports for common analysis tasks, such as production summaries, equipment performance, and alarm analysis.
- Custom Reports: Allows users to create custom reports tailored to their specific needs, using a variety of reporting tools and interfaces.
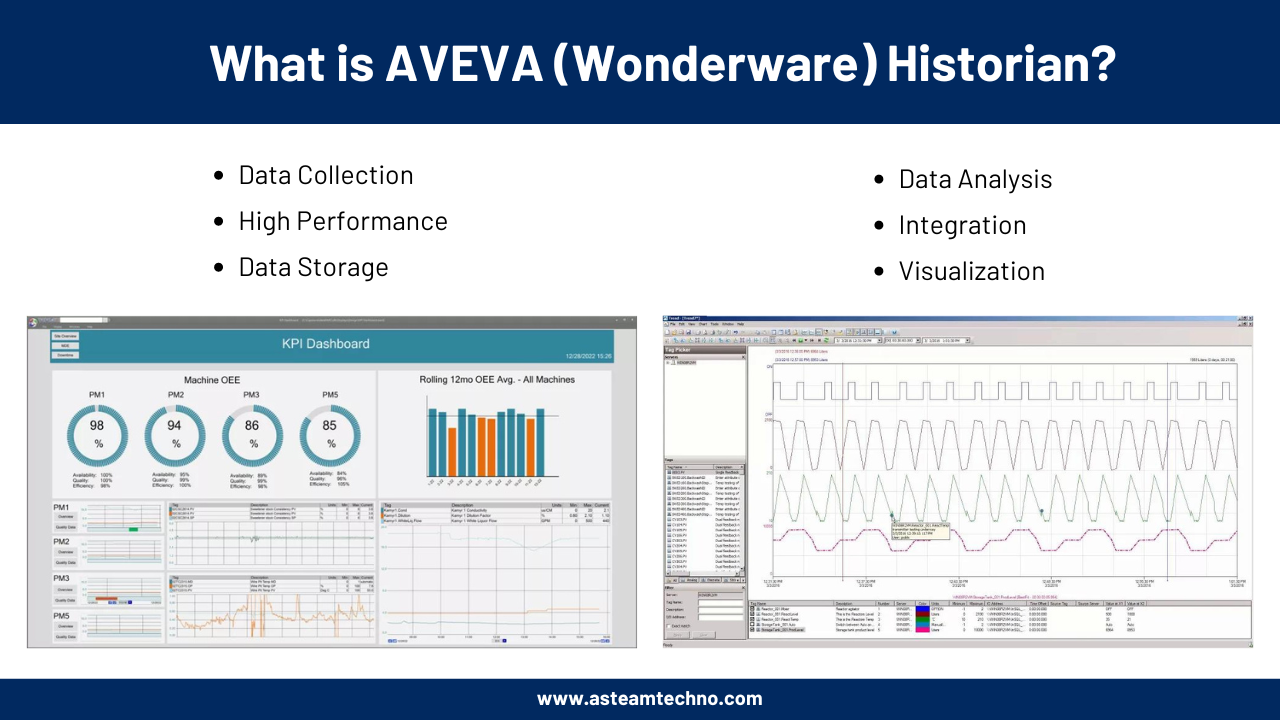
- Dashboards: Provides interactive dashboards that display real-time and historical data in a user-friendly format, enabling quick identification of trends and anomalies.
- Charts and Graphs: Offers various types of charts and graphs (e.g., line charts, bar charts, pie charts) to visually represent data, making it easier to interpret and analyze.
- Time-Series Analysis: Specialized tools for time-series analysis allow users to compare historical data over different time periods, identify patterns, and predict future trends.
5.Visualization:
Offers advanced visualization tools, including dashboards and reports, to help users understand and interpret their data.
- Real-Time Dashboards: Display real-time data from various sources, allowing users to monitor current operations and performance at a glance.
- Customizable Widgets: Includes a variety of widgets (charts, gauges, indicators) that can be customized to show specific data points and metrics relevant to the user.
- Interactive Elements: Offers interactive elements like drill-downs, filters, and time selectors to enable in-depth exploration of the data.
- Time-Series Charts: Specialized charts for displaying time-series data, such as line charts, area charts, and scatter plots, making it easy to see trends and changes over time.
- Bar and Pie Charts: Useful for categorical data analysis, showing comparisons between different categories or components.
- Heat Maps and Histograms: Provide insights into data distribution and density, helping to identify hotspots or areas of concern.
6.Scalability:
Scales from small, single-node installations to large, distributed systems, making it suitable for a wide range of applications.
- Distributed Architecture: AVEVA Historian can be deployed in a distributed architecture, where multiple nodes (servers) work together to handle data collection, storage, and analysis. This allows for load balancing and improved performance.
- Clustered Environments: Supports clustered environments where multiple servers are configured to work as a single system, providing redundancy, high availability, and seamless scalability.
- Data Replication: Implements data replication across multiple nodes to ensure data availability and consistency, even as the system scales.
7.Security:
Ensures data integrity and security through various built-in features and compliance with industry standards.
AVEVA Historian is commonly used in industries such as manufacturing, energy, water and wastewater, food and beverage, and more, where understanding and optimizing operational performance is critical.